Hi,
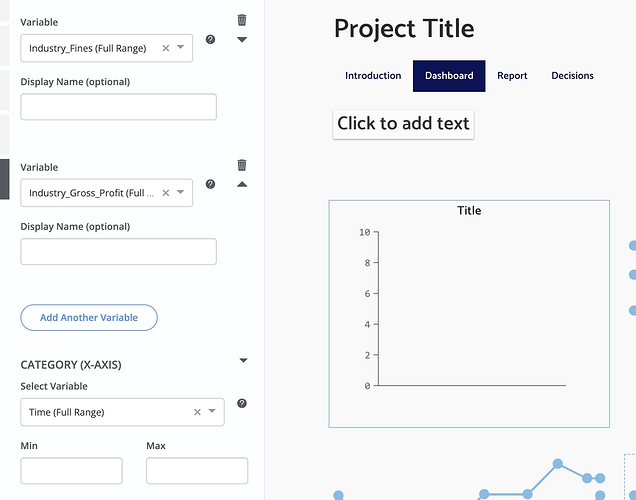
I have created a an excel sheet, named ranges and imported it into my project. I’m now trying to create dashboard charts and reports charts and data tables in the interface builder. I’m using Time (years, in my case; 2020-2030) on the x axis. I have tried selecting one of many different y-variables from the drop-down, but none of them are showing on the chart. Similar issue with the tables.
Any advice on how to get this feature working?
