Two issues: 1-Strange referral to old file 2-What to use on the X-axis of graphs

https://forio.com/epicenter/synmind
1-Old file
I suddenly get the message " Can no longer find model Circular-dynamics-bouw-11a.vmfx. Selected a new model to use with your interface. " ,whilst I have deleted this file and replaced it by …11b.vmfx
2-X-Axis
In Vensim I use a time step 0.25 and save per 1 (the 0.25 is needed to enable some integrals).
In the charts editor I can select time or Timestep or the related variablename. What should I do.? What should I choose? Or do I need some other settings? Strange that once I choose Time step I loose the option time

Thanks Joaquim
https://forio.com/epicenter/synmind
In addition to my previous post I would like to add that time in all my graphs ranges from 2020 to 2050 with annual increments (hence 30 data points in each graph).

Hi Joaquim–

When you change your model you must tell the interface builder about the new model file. Normally you are prompted to do this when you go into the interface builder after the model is changed. But if that doesn’t stick, you can edit the HTML file directly.

Click interface, then click “index.html” and click “edit”. Search the file for the model name
https://forio.com/epicenter/synmind/circular-dynamics-beton/static/blob/index.html

Change this

<body class="container-fluid builder-mode" data-f-model="Circular-dynamics-bouw-11a.vmfx">

to this

<body class="container-fluid builder-mode" data-f-model="Circular-dynamics-bouw-11b.vmfx">`

I’ve gone ahead and done this, but follow the above instructions as necessary in the future.

Hi Will

Thanks for comments. Can you also look at my question about the X-axis (see also my second mail ablut the time horzon and datapoints). This is not about an error but I just need advise how to proceed. I would like to enter all graphs in a proper way during the weekend because of a presentation monday, and therefore would be very happy to get your advise on this matter.

Thanks and have a good weekend.

Joaquim

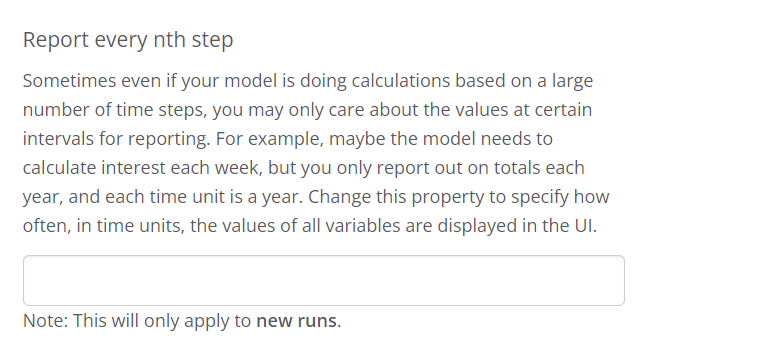
Hi – To properly show the time axis, in Vensim you need to have the Save Per be equal to the Time Step. If you want to show fewer points on the graph in the Forio Simulation, change the “Show Every nth Step” (reportPer) to 1, which shows data every 1 time unit, not every timestep of .25

Hi Will

  • I have reset the Save Per in Vensim on Timestep (0.25).

  • From your comment I take it that I have to change “Show every nth Step” to 1 in Forio? Unfortunately I can’t figure out where to do this.

Under Global / Model Settings, there is this option:

If you set this to 1, it will send data from the server to the browser every 1 time unit (not every .25 as it does now). This will cause the pages to load faster.

Note that this may look confusing at first because you will have runs with the larger amount of steps and fewer steps. You will need to delete all old runs in order for it all to match up after this change and display properly.