Introducing Forio Contour: Interactive JavaScript Visualization Library
Forio Contour is our new JavaScript visualization library.
We’ve been using Contour extensively on our own data visualization projects, and we’ve worked to make it into a tool that everyone can benefit from. We’ve put together extensive documentation, a gallery of sample components, and a couple of example projects. Now we’re ready to share it with the visualization community!
Why Create Another Graphing Library?
Many excellent plotting and graphing libraries already exist. Why did we develop our own instead of using an existing tool?
A big part of our work at Forio involves creating user visualizations for models and simulations.
We’ve worked with several visualization libraries, but we’ve found them too complicated … or too limited … or just plain too hard to use.
We thought it was about time to take what we’ve learned and make our own! And invite our friends and those in the community to use it and help us continue to expand it.
If you’re a JavaScript developer, experienced or aspiring, and are interested in interactive data visualization, we think you might be interested as well.
Design Goals
In building data visualizations for our simulations, we want something:
- flexible, so we can make all kinds of different graphs and charts, using data from many different sources and formats.
- extensible, so we can easily add reusable visualizations and customizations as we work on new projects.
- stylish, that is, something that embeds Forio’s design, so we don’t have to do all of our styling from scratch for every project.
- based on D3.js, which we think is a very powerful starting point, but just a little bit difficult to use for everyday work.
Introducing Forio Contour
Forio Contour lets you create data visualizations easily, based on intuitive abstractions commonly used in charts and graphs. Contour provides a core set of common visualizations that you can see in our gallery, and it’s easy to extend if you want to add your own customizations.
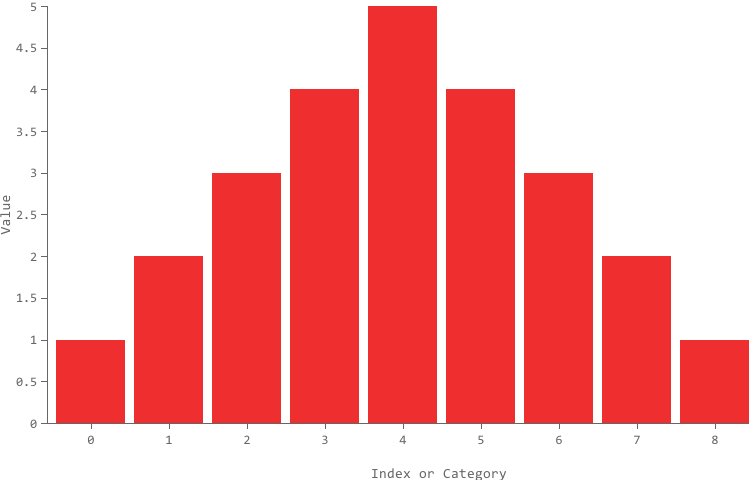
For instance, a basic column chart looks like this:
new Contour({ el: '.sampleColumnChart' })
	.cartesian()
	.column(data)
	.render();

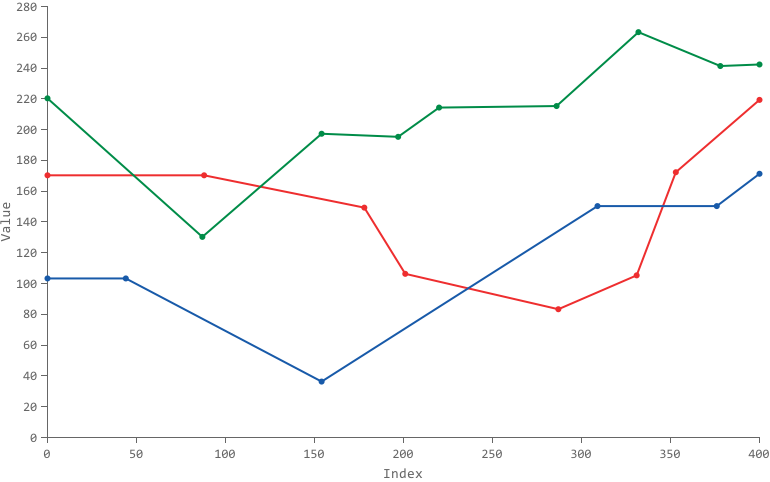
The data can be one series or several. For example, several line charts looks like this:
var redLine = [{x: 0, y: 170},{x: 88, y: 170},{x: 178, y: 149},{x: 201, y: 106},{x: 287, y: 83},{x: 331, y: 105},{x: 353, y: 172},{x: 400, y: 219}];
var greenLine = [{x: 0, y: 220},{x: 87, y: 130},{x: 154, y: 197},{x: 197, y: 195},{x: 220, y: 214},{x: 286, y: 215},{x: 332, y: 263},{x: 378, y: 241}, {x: 400, y: 242}];
var blueLine = [{x: 0, y: 103},{x: 44, y: 103},{x: 154, y: 36},{x: 309, y: 150},{x: 376, y: 150},{x: 400, y: 171}];
var data = [ {name: 'redLine', data: redLine}, {name: 'greenLine', data: greenLine}, {name: 'blueLine', data: blueLine} ];
new Contour({ el: '.line-multi-basic' })
    .cartesian()
    .line(data)
    .render();

While many common visualizations are part of the core Contour offering, it’s easy to extend if you want to add your own customizations.
Take a look at our gallery and examples, both of which include more sample code. Or dive right in and download, start playing, and send us your suggestions and extensions.
Happy visualizing!
